PACTA Climate Alignment Report
Emerging Markets
iShares MSCI Saudi Arabia ETF (KSA)
Legal disclaimer PACTA Interactive report.
IMPORTANT INFORMATION The PACTA Model generates a limited ‘point in time’ estimate of the relative alignment of the Revealed Plans of Securities in the Scope versus the economic trends embodied in the Scenario(s), as identified by external data and scenario providers.
EXCLUSION OF LIABILITY TO THE EXTENT PERMITTED BY LAW, RMI WILL NOT BE LIABLE TO ANY USER FOR ANY LOSS OR DAMAGE, WHETHER IN CONTRACT, TORT (INCLUDING NEGLIGENCE), BREACH OF STATUTORY DUTY OR OTHERWISE, EVEN IF FORESEEABLE, ARISING UNDER OR IN CONNECTION WITH USE OF OR RELIANCE ON ANY INFORMATION, DATA OR CONTENT OBTAINED VIA OUR SERVICES, INCLUDING (WITHOUT LIMITATION) THE MODELLING OUTPUTS STATED IN THIS REPORT.
No forecast or prediction The PACTA Model does not purport to generate, nor does this Report contain or comprise, statements of fact, forecasts or predictions. The PACTA Model provides a ‘point in time’ analysis of economic and commercial variables that are inherently dynamic and variable over time. RMI neither makes nor implies any representation regarding the likelihood, risk or expectation of any future matter. To the extent that any statements made or information contained in this Report might be considered forward-looking in nature, they are subject to risks, variables and uncertainties that could cause actual results to differ materially. You are cautioned not to place undue reliance on any such forward-looking statements, which reflect our assumptions only and those of our data and scenario providers as of the date of modelling.
No financial advice The information contained in this Report does not comprise, constitute or provide, nor should it be relied upon as, investment or financial advice, credit ratings, an advertisement, an invitation, a confirmation, an offer or a solicitation, or recommendation, to buy or sell any security or other financial, credit or lending product or to engage in any investment activity, or an offer of any financial service. This Report does not purport to quantify risk to the portfolio (or any part thereof), nor make any representation in regards to the performance, strategy, prospects, creditworthiness or risk associated with any investment, nor their suitability for purchase, holding or sale in the context of any particular portfolio. The Modelling Outputs reflected in this Report are provided with the understanding and expectation that each investor will, with due care, conduct its own investigation and evaluation of each security or other instrument that is under consideration for purchase, holding or sale.
Scope Securities The PACTA Model is limited in its scope and application. It does not consider all securities across all sectors, nor all securities within those sectors. The PACTA Model applies only to the Scope Securities set out in the Methodology Statement, as updated from time to time.
Scenario(s) The PACTA Model will apply one or more Scenarios, as set out in the Methodology Statement. The choice of any Scenario should not be taken as any endorsement of those scenarios, nor any statement as to the accuracy or completeness of those scenarios’ methodologies or assumptions, nor as a general preference of those scenarios over any other economic scenarios. The analysis provided by the PACTA Model may be carried out using other economic scenarios, and users must form their own view as to the decarbonization scenarios, trajectories, and models that are most appropriate to their portfolio. No explicit or implicit assumption is made in relation to the current or future alignment of the Scenarios with climate-related policies of any government at international, national or sub-national level.
Use of the PACTA method may support you in initiatives undertaken with regard to the Recommendations of G20 Financial Stability Board’s Taskforce on Climate-related Financial Disclosures (TCFD). However, its use in isolation does not purport to provide ‘TCFD compliance’.
1 Introduction
1.1 About PACTA
In September 2018, the 2° Investing Initiative (2DII) introduced the Paris Agreement Capital Transition Assessment (PACTA) tool: a free and open-source software that calculates the extent to which corporate capital expenditures and industrial assets behind a given equity, bond, or lending portfolio are aligned with various climate scenarios.
The development of PACTA, however, dates back to 2014 when 2DII began developing the tool in partnership with academic organizations including the Frankfurt School of Finance and the University of Zurich, funding from the European Commission, German and Swiss governments, and support from UN Principles for Responsible Investment. Since the tool was launched, more than 4,500 individuals from more than 3,000 institutions have used it to conduct over 18,000 tests, with an average of 600+ tests per month. Overall, the total assets under management of financial institutions using the tool amounts to more than USD 106 trillion.
As of June 2022, 2DII transferred the stewardship of PACTA to RMI in order to scale up the impact of the tool in the financial sector and in the real economy. Under RMI’s stewardship, PACTA remains a free, independent, and open-source methodology and tool.
PACTA now forms part of the Climate Finance programme at RMI, and supports RMI’s mission by helping to shift capital flows in greener directions and enabling the financial sector to contribute to the goals of the Paris Agreement. PACTA does so by providing the financial and supervisory community with forward-looking, science-based analysis.
In order to achieve its objective, the results generated by PACTA allow users to get a granular view of the exposure and climate goal alignment of their portfolios by sector and for related technologies. This information can be used to
- help steer investment decisions in line with climate scenarios;
- inform decisions in relation to climate target-setting;
- gain insights that can support engagement with clients on their respective climate actions;
- identify exposure to transition risks associated with a disruptive shift to a low-carbon economy.
1.2 About This Report
This set of reports analyze the transition outlook for selected emerging and developed markets. For the development of the analysis, the iShares ETFs that track the leading MSCI country indices were considered as a proxy of the most relevant set of listed securities for each economy. The tables below provide a summary of the ETFs included in the analysis, and for which an individual report is available. The tables further provide information on the countries that are part of the aggregate emerging and developed markets reports.
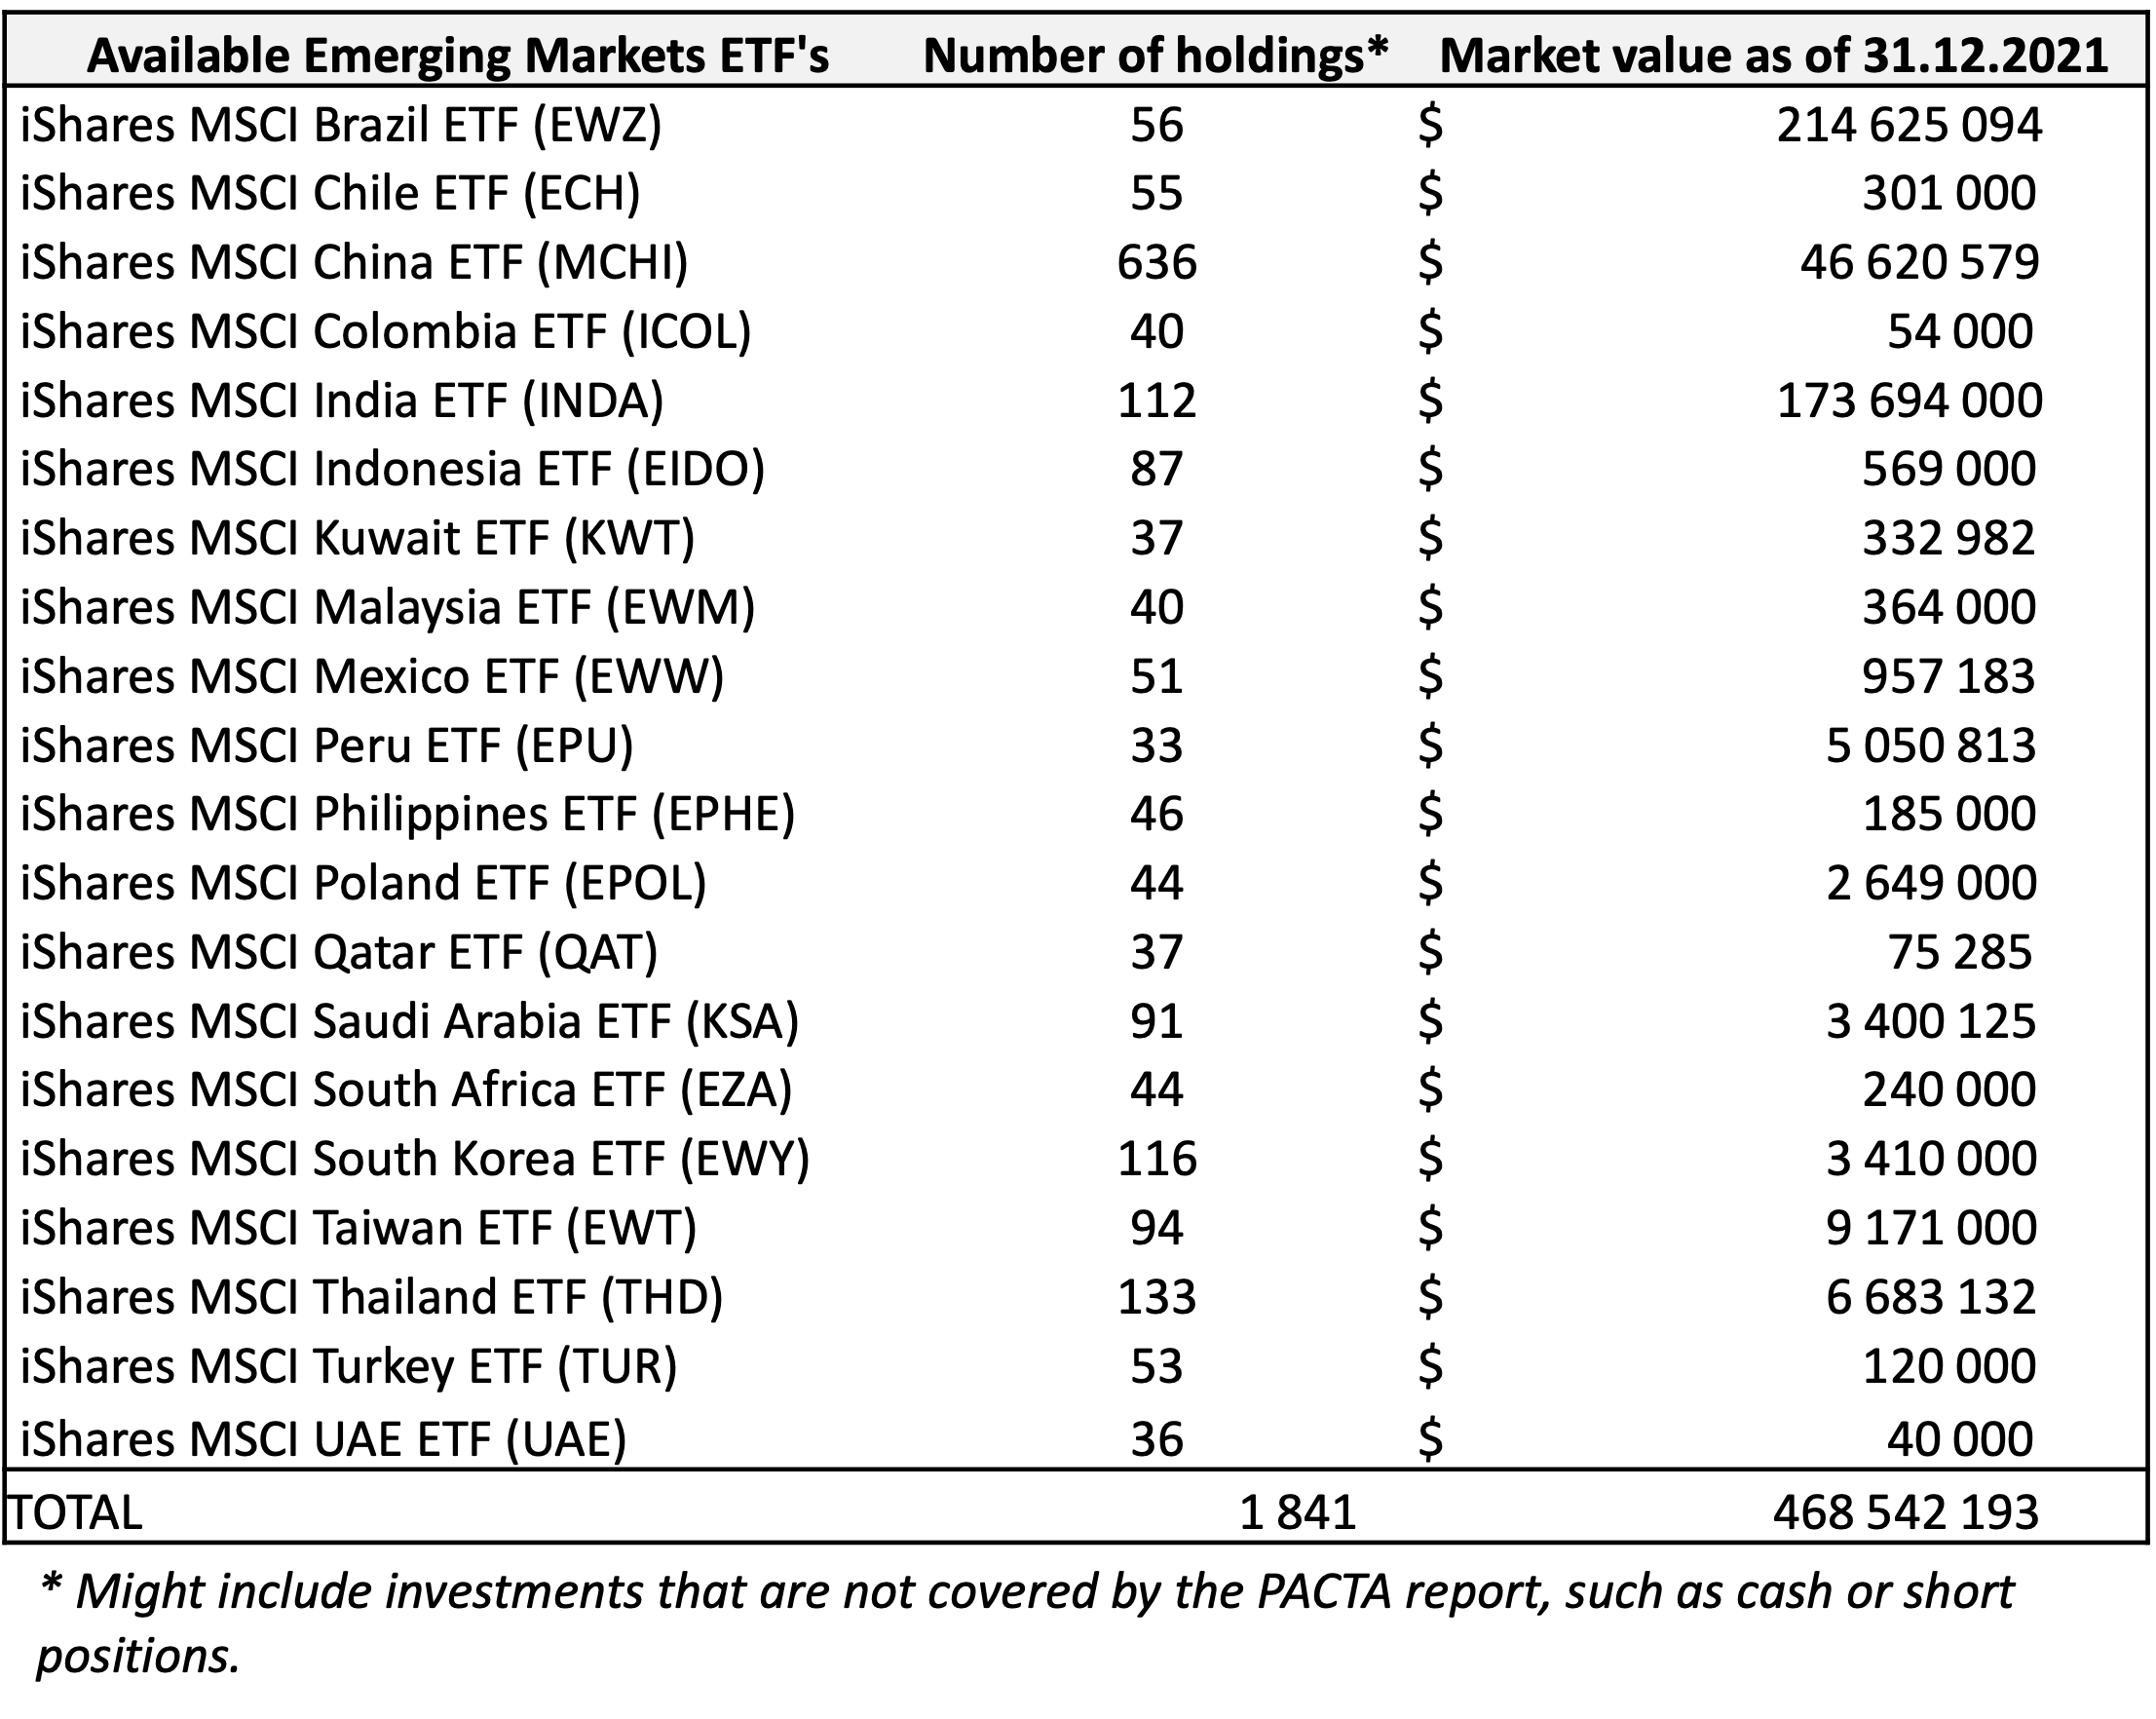
Figure 1.1: List of ETFs available for Emerging markets. For each of these ETFs, there is a PACTA report available, furthermore, there is a report that aggregates the portfolios of this set of ETFs.
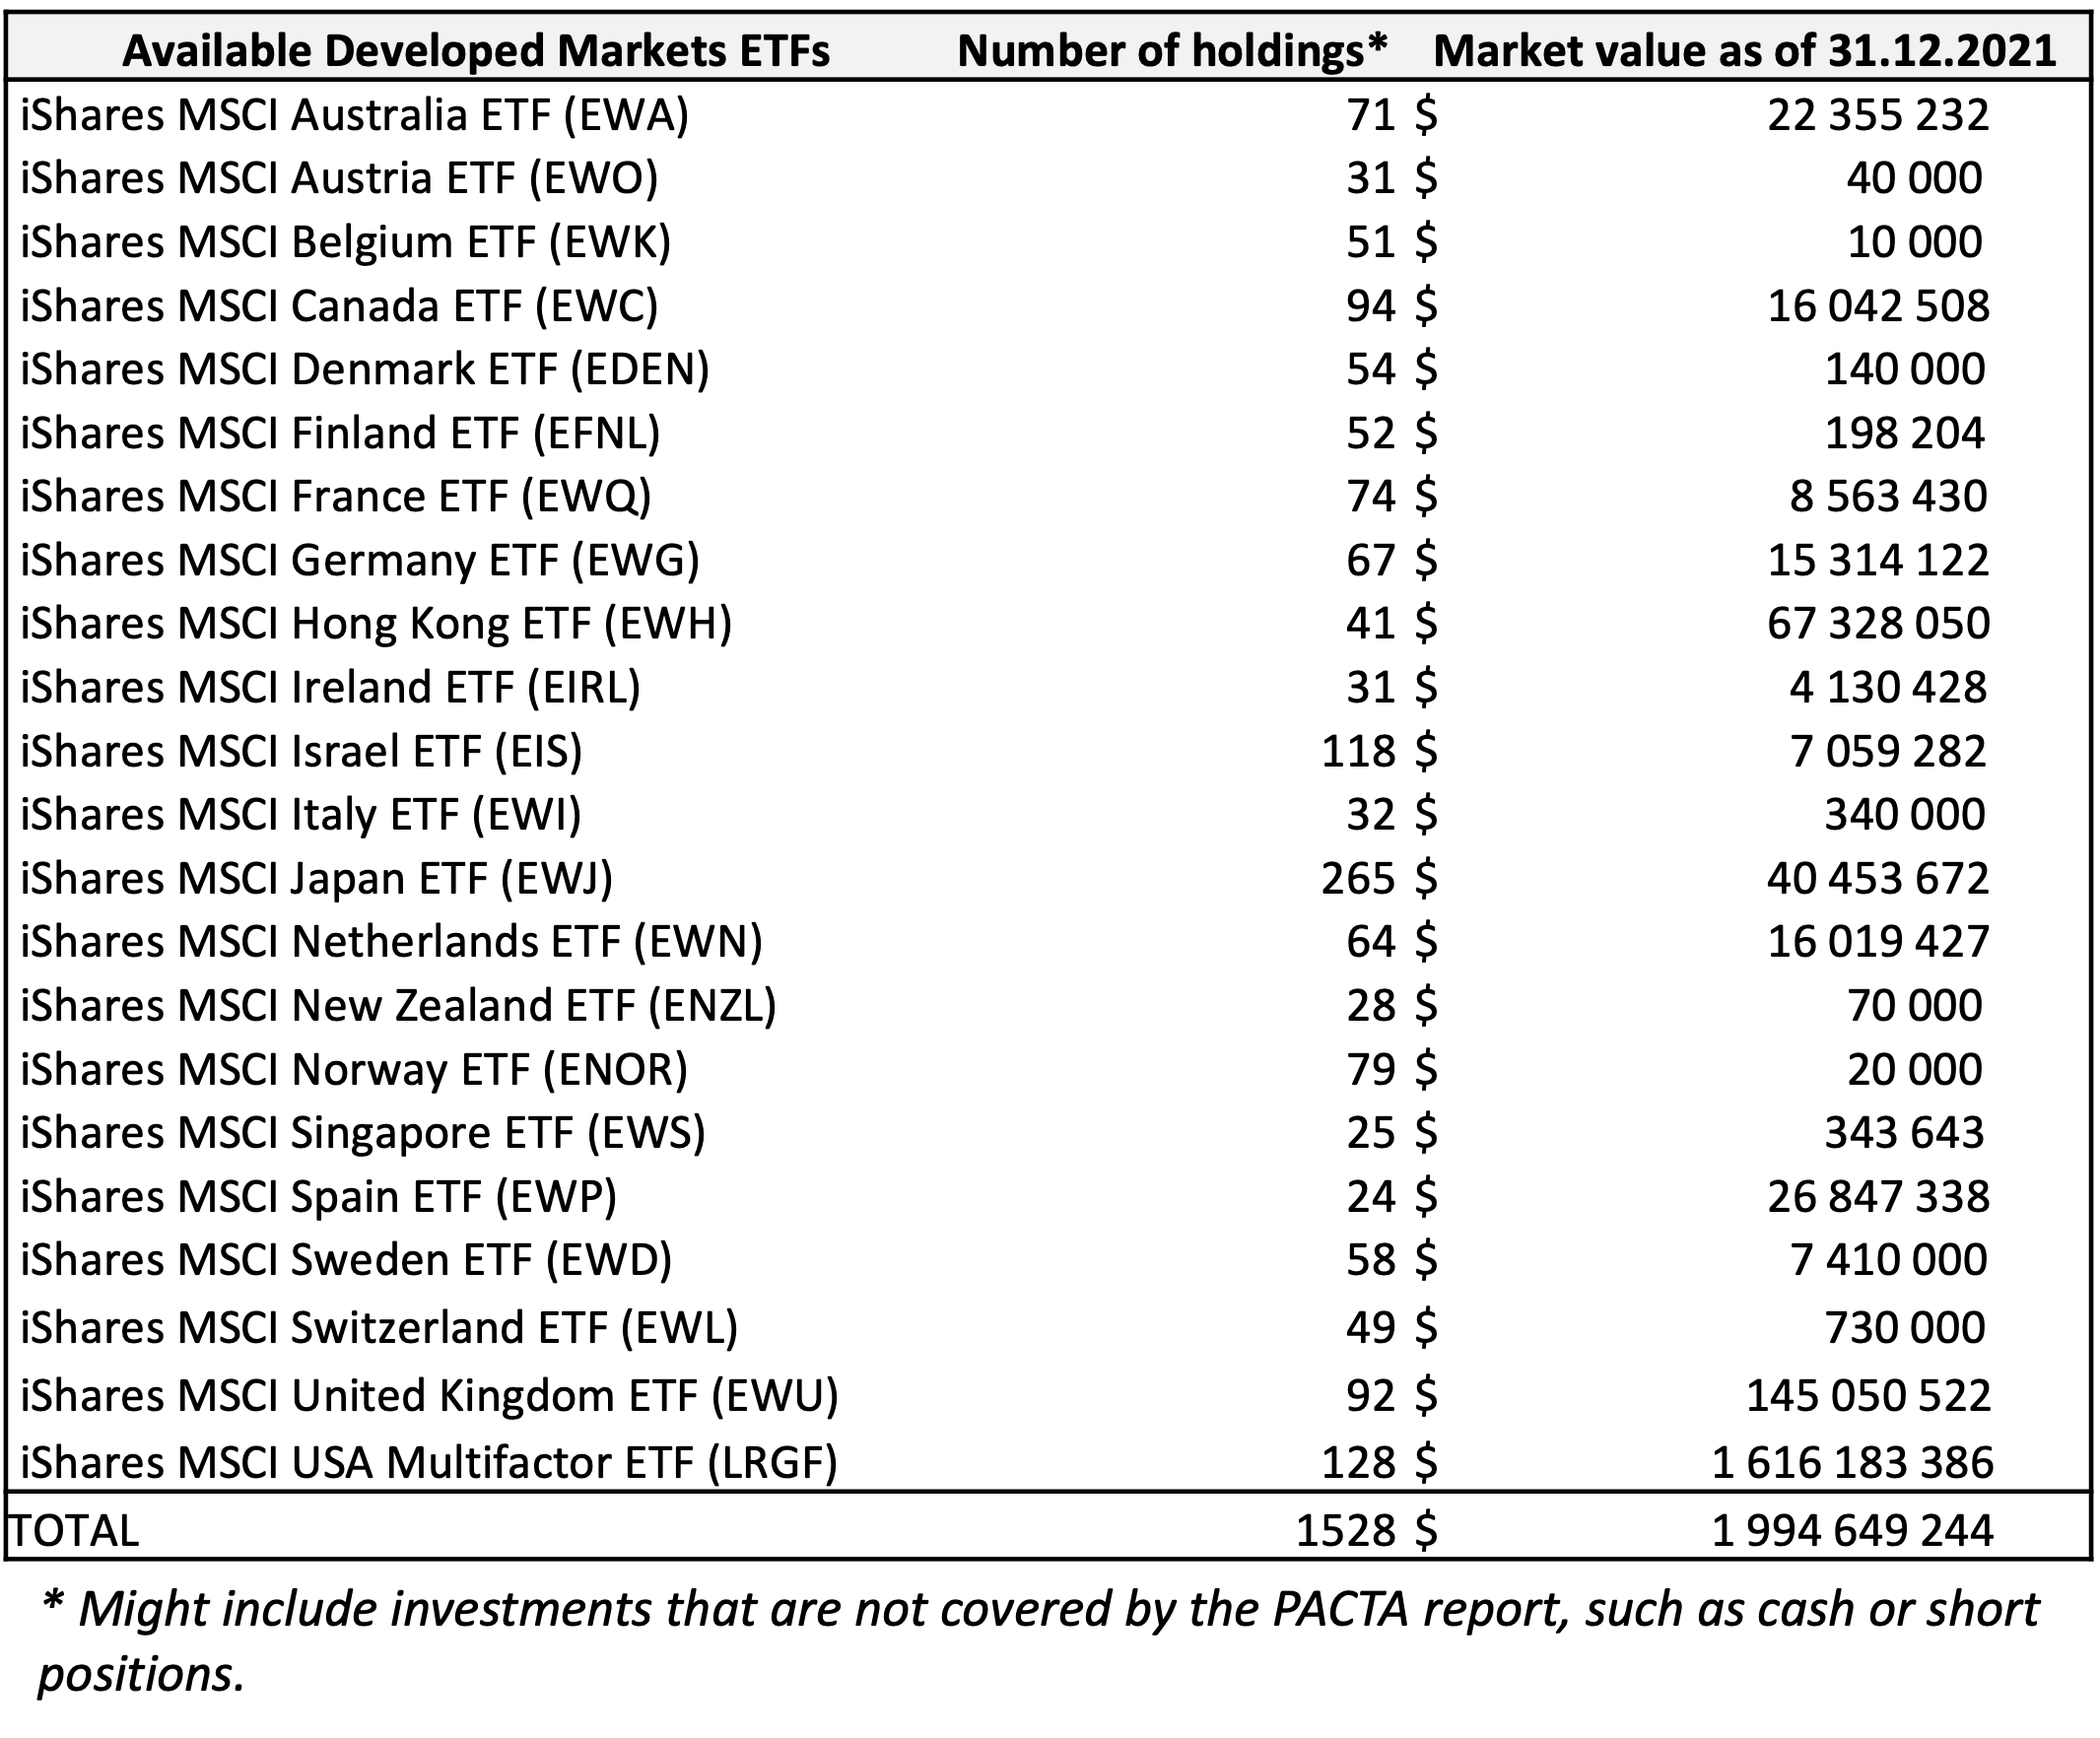
Figure 1.2: List of ETFs available for developed markets. For each of these ETFs, there is a PACTA report available, furthermore, there is a report that aggregates the portfolios of this set of ETFs.
For the market classification, the MSCI criteria was taken into account, since it intends to reflect the functioning and practices of the international financial market, offering a balance between the economic development of the countries and the accessibility to their financial markets. This classification methodology considers three factors: economic development, size and liquidity, and accessibility. For a country to be classified in a market, it must meet certain requirements, which are presented in the table below.
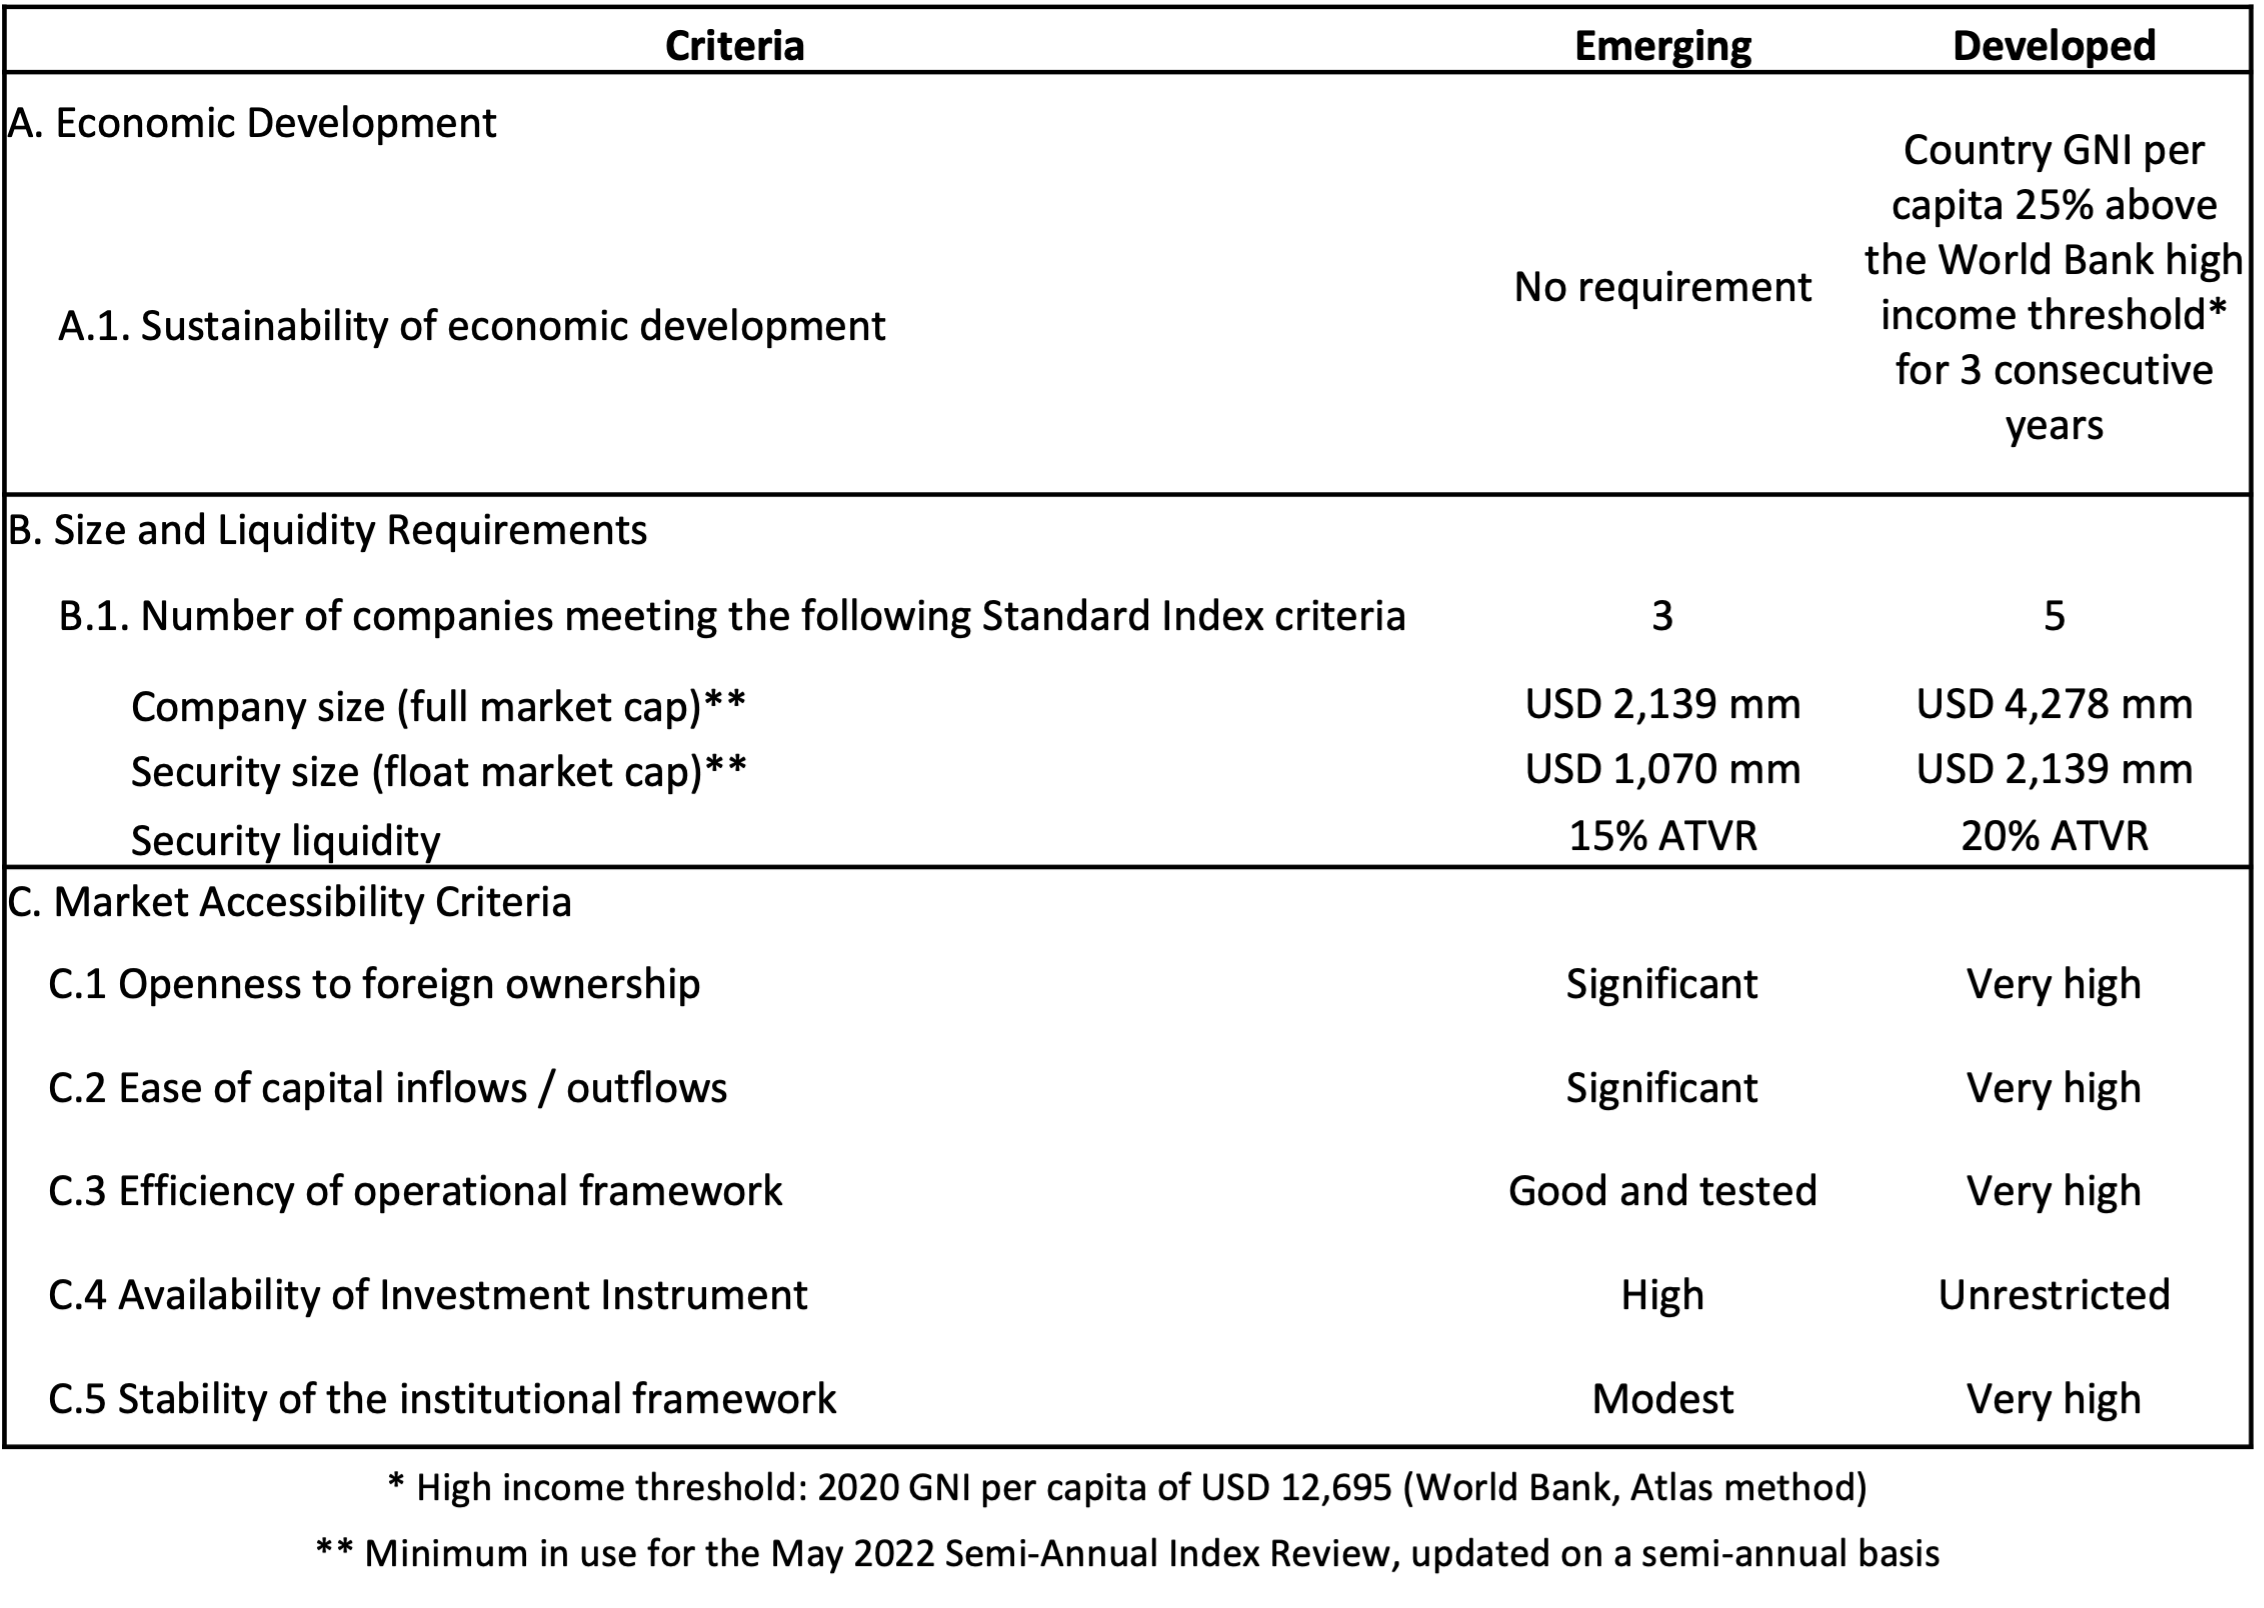
Figure 1.3: MSCI Market Classification Framework for Emerging and Developed Markets
The Climate scenario analysis for listed equities and corporate bonds, based on the PACTA methodology, provides answers to the following questions:
- What proportion of the portfolio is invested in carbon-intensive sectors?
- How relevant is the analyzed portion of my portfolio in terms of my overall portfolio emissions?
- Which climate change scenarios do the production plans of the companies in the portfolio align with?
- Which companies in the portfolio significantly influence the results?
- How does the portfolio perform compared to market benchmarks?
Please note that this report focuses on equity markets, therefore, the analysis presented will reflect the performance of this asset class. Important information about the PACTA methodology is summarized in the final chapter. Further information can be found in the PACTA Knowledge Hub, including a detailed explanation of the methodology and the underlying sources of data, as well as information which can help you to interpret the results.
1.3 Economic Sectors Covered in PACTA and Their Relevance for Limiting Climate Change
Climate change is already with us and the physical effects are already being felt around the world. Many enterprises will have to transform their businesses or adapt their value chains and internal processes in order to avoid major disruption and economic losses. Economy wide action will be needed to mitigate and adapt to climate change, with investment to reduce CO2 emissions in a number of key sectors being vital in order to avert dangerous levels of global warming from occurring.
If we look at the overall contributions to global greenhouse gas (GHG) we can quickly see where priority action and investment is needed. Approximately 73% of greenhouse gas (GHG) emissions come from the energy sector (Electricity, heat and transport), 18,4% from agriculture, forestry and land use, 5.2% direct 9industrial processes (Cement and Chemicals and petrochemicals), and 3,2% from waste.1
PACTA covers seven sectors that are amongst the most carbon-intensive sectors of the economy, and, therefore, are likely to be more exposed to climate transition risks. Those key sectors are Oil and Gas, Coal, Power, Automotive, Steel, Cement and Aviation. In each sector, PACTA focuses on the part of the value chain which makes the largest contribution in terms of CO2 emissions and where the potential influence and impact on emissions can therefore be greatest. PACTA alignment metrics are then selected to measure the technology transitions that will be needed in each of those value chains, with a focus on the phaseout of high carbon technologies and the ramp up of low carbon technologies (´climate solutions´).
As an example, in the oil and gas sector, the focus is on upstream activities related to production, while in the power sector, the focus is on power generation capacity and related sources of energy. For more information regarding the parts of the value chain that PACTA focuses on, see Figure 1 below.

Figure 1.4: PACTA Sectors
Figure 1: PACTA Sectors for listed equity and corporate bonds. Supply chain segments with the largest contribution to climate change are with a blue background.
Because PACTA covers sectors with very different value chains, the scope of the emissions addressed by the analysis also varies between sectors. As an orientation, the Greenhouse Gas Protocol defines and categorizes emissions into scopes 1, 2, and 3. This widely used corporate standard aims to support companies to understand of their full value chain emissions. According to the Greenhouse Gas Protocol, the scopes are defined as follows2:
- Scope 1: GHG emissions occurring from sources that are owned or controlled by the company, for example, emissions from combustion in owned or controlled boilers, furnaces, vehicles, etc.; emissions from chemical production in owned or controlled process equipment;
- Scope 2: GHG emissions from the generation of purchased electricity consumed by the company;
- Scope 3: GHG emissions resulting as consequence of the activities of the company but occur from sources not owned or controlled by the company. Some examples of scope 3 activities are extraction and production of purchased materials; transportation of purchased fuels; and use of sold products and services.
PACTA measure alignment with scenarios using a combination of production capacity and CO2 emissions intensity metrics. So whilst for the power, automotive, oil & gas, and coal sectors, production capacity metrics are used rather than GHG emissions, it can be reasonably inferred based on modeling by the scenario developer and the metrics used by PACTA, that the analysis covers scope 1 for aviation and power, scopes 1 and 2 for steel and cement, and Scope 3 for automotive, coal, oil and gas.
1.4 The PACTA Methodology at a Glance
PACTA compares what needs to happen in sectoral decarbonization pathways as modelled by climate scenario providers with financial actors’ exposures to companies active in oil and gas, coal, power, automotive, cement, aviation, and steel (the “PACTA sectors”). PACTA provides a five-year forward-looking, bottom-up analysis. In particular it focusses on the technology transitions that need to take place, with scenarios indicating that high emitting technologies will need to be phased out and low carbon technologies will need a ramp up of their production. The scenarios used quantify the technology shifts and sectoral decarbonization required to meet the Paris Agreement objectives to limit global warming to ´well below 2 degrees´ and to ´below 1.5 degrees´.
The analysis looks at companies’ 5-year forward-looking production plans based on physical asset-based company level data and consolidates that information in order to analyze how aligned their production trajectory is in comparison with that of different climate scenarios. This information is then aggregated to provide results at the portfolio level. The current (mis)alignment between a portfolio and these scenarios allows users to infer their potential exposure to both transition risks and opportunities on a forward-looking basis. The information provided by the PACTA analysis can as a result be used by investors for:
- transition risk management,
- identification of engagement opportunities and needs with companies,
- disclosure and reporting,
- strategy setting, and
- decision making.
In order to support investors and their different needs for information, the climate scenario analysis provides answers to the following questions:
- What portfolio share is currently exposed to activities in sectors affected by the transition to a low carbon economy?
- How aligned are the investment and production plans of companies in the portfolio with different climate scenarios?
- What is the portfolio’s technology mix in climate-relevant sectors expected to look like in five years based on the current investment plans of the companies in the portfolio, and how does it compare to peers, the market, and a technology mix aligned with the Paris Agreement?
- Which companies are driving the results of the portfolio’s exposure and alignment?
The following table provides an overview of key components and principles underlying the PACTA methodology.
| Physical asset-based company level data (ABCD) | The analysis is currently based on data covering 52,000+ companies and 230,000+ energy-related physical assets from third-party data providers. This alleviates the necessity to rely on companies’ self-reported data that is published in a non-standardized manner and often does not account for scope 2 and 3 emissions. |
| Forward-Looking | PACTA provides a five-year forward-looking analysis of the production plans financed by a portfolio that are compared to climate scenarios. |
| Sector-specific approach | The outputs of the analysis are metrics and indicators at sector and technology-level that allow for a detailed evaluation of a portfolio’s alignment, rather than one aggregated indicator at portfolio level. |
| Allocating macroeconomic goals to microeconomic actors | The PACTA analysis uses a market-share approach to allocate macroeconomic climate targets to companies in sectors where low-carbon technologies are available thus, all market-level trends and targets are allocated to companies based on their current market share in the sector or technology for low- and high-carbon technologies, respectively. |
In the analysis provided for each sector, the user has the option to select from two different portfolio attribution methodologies - the Portfolio Weight Approach (PA) and the Ownership Weight Approach (OA). These methods are used to attribute the physical assets of a company to the financial instrument or portfolio.
The approaches differ as follows:
Portfolio Weight Approach (PA): This approach calculates the portfolios’ technology exposures based on the weighting of each position within the portfolio. Therefore, the PA reflects the investor’s allocation choice. This approach is used for the analysis of corporate bonds and can be used for listed equity as well.
Ownership Weight Approach (OA): This approach assigns a share of the companies’ activities to the portfolio based on the percent of outstanding shares owned by the investor. This approach comes closer to allocating “responsibility” for the companies’ activities to the financial institution.
While the Ownership Weight Approach (OA) is only available for listed equity, the Portfolio Weight Approach (PA) is available for both corporate bonds and listed equity.
1.4.1 PACTA core metrics
The PACTA analysis measures alignment using three different metrics, the first two of which are based on production capacity:
- Technology Share Mix,
- Production Volume Trajectory,
- Emission Intensities.
The technology share mix and the volume trajectory are used for the power, fossil fuels, and automotive sectors, for which there exist clearly identified technology decarbonization pathways. For example, in the power sector, there are technologies to which the sector can transition, i.e., coal-fired power generation can shift to renewable power production. For other sectors, where the technology transitions are not so well defined, such as steel, cement, and aviation, PACTA uses a physical emissions intensity metric. Each of these three metrics are explained in turn below:
Technology Share Mix
The technology share mix metric represents the weight of each technology in the sector as a percentage of the portfolio investment and the result of the analysis are displayed in section 3.1. This metric therefore measures the portfolio’s relative exposure to the economic activities that are impacted by the transition to a low-carbon economy. The portfolio’s technology mix is also compared to the scenario and a market benchmark.
The technology share mix metric provides direct information on the technology shifts within the power, fossil fuels, and automotive sectors. The technology shifts can be divided into two types of changes: Firstly, (i) the changes in the technological processes by which outputs are produced (e.g., shift from coal-fueled to renewable-fueled power generating capacity). Secondly, (ii) changes in the nature of the output itself (e.g., shift from the production of internal combustion engines to electric vehicles).
Production Volume Trajectory
The production volume trajectory metric measures the forward-looking climate goal alignment of a portfolio’s projected production volumes per technology. To do this it compares the five-year forward-looking capital commitments of companies in terms of production to the company’s target production volume trajectories calculated based on different climate scenarios. This metric can only be applied to sectors with clear technology pathways (oil and gas, coal, automotive, power). The results of the analysis are displayed in section 3.2.
Changes in companies’ technology-level production volumes result either from the transfer of production from one technology to another (e.g., internal combustion engines to electric vehicles) or from the sheer expansion or contraction in production associated with a technology or fuel (e.g., a company brings a new coal-fired power plant online).
Emissions Intensity Metric
The emissions intensity metric measures the average CO2 intensity of the portfolio in the steel, cement, and aviation sectors. This metric is a measure of physical emissions intensity as the emissions of CO2 are normalized to an economic unit of output (for example, CO2 per ton of steel produced). This is then compared to the reduction trajectory for emissions intensity set out by a climate scenario for a sector.
The emissions intensity of the activities financed by the portfolio is the main metric used in sectors for which no clear technology pathways have been set out (namely, steel, cement, and aviation). For these sectors, no clear zero-carbon alternative technology yet exists. As such, it is not possible to use the technology mix metric or the volume production volume trajectory metric to measure alignment. However, scenarios still indicate how emissions must be reduced substantially in these sectors using a combination of different solutions. It is therefore still imperative to steer capital in a way that aims to decrease carbon emissions in these sectors in line with the scenario trajectories – hence the emission intensity metric is used.
1.5 Practical Tips To Get the Most Out of Your Report
Interactive graphics. Most of the charts in this report are interactive. They allow you to select specific benchmark scenarios, geographical areas, sectors and methods which you can compare. In the case you would like to review multiple charts, by hovering your pointer over the chart and clicking on the plus button that appears, you can add additional charts to the report and change these parameters as you wish.
Feedback. You can if you like provide your feedback on each chart by clicking on the text bubble which appears when hovering your point over the chart. We appreciate receiving your feedback as it will form the basis for improving this report and the PACTA method.
Method and data set. Each section of the report contains basic information about the methodology and the underlying data. You can find more detailed information at the Knowledge Hub.
Downloading graphics and data. By hovering over the right hand corner of each chart you are able to download the underlying data and a png version of the charts. We welcome you to use this for further analysis or rebranding of the graphics and request only that you refer to the PACTA tool as the source of the data.
Sharing the report and the results. This report can be shared by clicking on the button in the bar above this report. This creates a link that allows anyone with that link to access the results and contents of this report. Please note this link can be accessed online by anyone without a log in. No underlying portfolio data is made available through this process, however the aggregated results for the portfolio are still able to be downloaded.
Grouping these results. If you have uploaded several portfolios, you can group them together to create aggregated results. This can be done on the Results page of the platform.
2 Scope and Parameters of the Analysis
This chapter outlines the scope and coverage of this PACTA analysis by answering the following four questions:
What are the holdings analysed in this assessment?
Which asset classes are covered in the analysis?
Which sectors are covered in the analysis?
How much of the portfolio’s emissions are approximately covered?
2.1 Asset Classes
This analysis focuses on asset classes with the most direct and traceable impact on the real economy, and for which public data is available. These are direct investment in economic activities by investments through listed equity and corporate bonds on the secondary market. From the total market value of this portfolio, which corresponds to 983,953,265 USD, 100 % correspond to listed equity. The table below summarizes which financial instruments are included in the analysis.
2.2 Sector Coverage
This analysis can be applied to listed equity and corporate bonds in climate-relevant sectors (oil and gas, coal, automotive (light duty vehicles), power, cement, steel, and aviation).
Sectors included in the analysis fulfill the following three criteria:
The sectors are relevant from a climate perspective and contribute significantly to the global greenhouse gas (GHG) emissions;
There are scenario benchmarks available for each sector and;
There is sufficient data and business intelligence available.
Other sectors like agriculture, forestry, aluminum, paper, and glass are also climate-relevant, but given the lack of asset or scenario level data, they are therefore not included in the analysis. Please note that the graph below represents the market share invested in PACTA sectors, and therefore incorporates all segments of the value chain.
Understanding the Graph
The pie chart shows the financial sector split of the total investment in the selected asset-class. The share that is invested in companies in climate-relevant sectors is represented by the colored slices.
2.3 Absolute CO2 Emissions
PACTA is a granular and forward-looking climate alignment tool. Where possible it measures alignment using production capacity metrics. For the sectors where it is not possible physical emissions intensity is measured instead of “financed emissions,” because values can be compared with those of sectoral pathways. Nevertheless, estimating the current absolute CO2 emissions associated with a portfolio can be useful in informing about the relative importance of each sector in decarbonizing the portfolio.
In providing this metric it is important to note that databases with different timestamps are used. This metric is generated using financial and scenario information for the year of the analysis but with emissions data with a one-year lag. This is because CO2 emissions data often lags by up to one year due to company reporting cycles and data preparation processes. The data is sourced from market-leading data provider that updates ESG emissions on an annual basis. If a company reports its emissions by the end of June in a given year, they undergo a due diligence process with our data provider, and the data will not be available for our analysis before December 31st.
It is also relevant to note that with the aim to provide the maximum amount of information and coverage, the data provider offers emissions data from different sources, the following of which are included in this report as follows: emissions modelled based on company information (76%), Company sustainability report (12,4%), company reported data gathered by the Climate Disclosure Project (CDP) (10%), and others (1,6%).
For the PACTA analysis with timestamp 2021Q4, an exception has been made to address the post Covid 19 recovery period and so 2019 data is used for all companies that have information for that year. This is because the 2020 data may present information that does not represent business as usual because not all companies had normal production levels due to Covid 19. This does not affect any of the calculations previously described.
The charts below indicate the contribution of each of the sectors to the total emissions assigned to the equity and bond portfolio. Comparing these graphs to the graphs from the previous section emphasizes the importance of the analyzed sectors in terms of climate relevance. While making up 100 % of the equity portfolio value, by emissions the PACTA sectors are responsible for the following share of the portfolio’s estimated absolute CO2 emissions:
Understanding the Graph
The pie chart shows sector split of the estimated total absolute emissions attributed to the investments in the selected asset-class. The emissions from companies in the PACTA sectors is represented by the colored sections.
3 Climate Scenario Analysis
This chapter presents the results of the PACTA climate scenario analysis of listed equity and corporate bond portfolio holdings.
The first three sections show portfolio’s exposure to climate-relevant sectors, as well as the alignment of production plans of companies in this portfolio with different climate scenarios. To understand these results better, the next section highlights how the company-level production plans are driving these results. The performance of this portfolio is then compared to the benchmark.
To better understand the methodology underlying these charts, please refer to the Knowledge Hub.
3.1 Exposure to PACTA Sectors
In this section, the exposure of the portfolio to different sectors, technologies, and geographies is shown. This analysis is based on an aggregation of the weight of the companies mapped to the climate-relevant sectors in the portfolio. This section addresses the following questions:
What is the current exposure of the portfolio to climate relevant technologies?
How much of the portfolio is invested in low- and high-carbon technologies?
How is the exposure of the portfolio regionally distributed?
3.1.1 Current exposure
Within the climate relevant sectors, each technology differs in its role in the low-carbon transition of this sector. Understanding the exposure of the portfolio on a technology level provides the basis to understand transition risks as well as potential climate investment strategies applicable to this sector. The following chart shows the exposure of the analyzed portfolio data to the different technologies within each sector.
Understanding the Graph
For each sector, there are two views that can be seen in this chart. The first show the technology mix as a % of assets under management. This represents the percentage of the portfolio in these sectors and technologies. The second option shows the technology breakdown of the sector. The green line underneath the bars represents the portfolio of the sector in low carbon technologies according to the scenario. The second bar shows the benchmark which can be changed by clicking on the benchmark text. An option also exists to subset the results by an alternative equity market for the equity portfolio.
3.1.2 Geographic exposure
The map below provides information on the regional exposure of this portfolio. It includes two basic insights: it gives a geographical dimension to the exposure per sector or technology as well as a sectoral view with regards to individual countries. This is of importance for understanding regional diversification and potential exposure to risks specific to specific countries.
Understanding the Graph
The color shading shows the production of a specific technology in the respective country. This is possible as the asset-level data for all companies in the portfolio includes information about the geographical location of each asset. The production capacities in each country are aggregated by weighting the contributions of each company by their weight in the portfolio.
3.2 Alignment With Climate Change Scenarios
This section assesses the forward-looking alignment of the companies in this portfolio with different climate scenarios. The results presented in this chapter provide answers to the following questions:
Which climate scenarios are the production trajectories of this portfolio aligned with?
What is the current exposure of this portfolio to technologies and how does this change over the course of five years?
What is the relative exposure between technologies in each sector in five years?
How do emission intensity reductions in relevant sectors in this portfolio compare to climate scenarios?
3.2.1 Alignment of production trajectories
This section assesses the alignment of a portfolio to a range of climate transition scenarios based on the production plans of the companies in the portfolio. This analysis is only possible for sectors with sufficiently granular technology decarbonization road maps, namely the power, coal and oil and gas, automotive sectors. From this, the future alignment (at 5 years) can be inferred, and this is also benchmarked against indices. This can be used to inform risk management, target setting and climate strategies. A section on interpreting the results in provided at the bottom. Please note that the five-year scenario trajectories depend on the scenario assumptions. Certain scenarios expect technological changes to happen more rapidly than others, and this is reflected in the chart below. For more information related to the scenarios available in the tool, please refer to the “Pacta for investors Scenario document”.
Remember you can investigate different options here by clicking on the boldened text and changing the parameters behind these results. You can add additional charts by clicking on the Plus button that appears when you hover over the upper right of the chart.
Understanding the Graph
The solid line indicates the development of the production in the selected technology for the next 5 years. The colored areas indicate the required change in production according to different climate scenarios. The dashed area represents the chosen benchmark scaled to the starting point of the portfolio. The benchmark, allocation method, and equity market can be changed by clicking on the boldened values.
3.2.2 Future technology breakdown
For sectors with low carbon alternatives such as the power and automotive sectors, it can be useful to compare how the split between technologies looks in five years in comparison to what is expected under scenarios and with what the benchmark is doing in this regard.
This chart shows the split of each sector within the portfolio by technology, both what is currently planned and what is expected under the specified scenario. This chart does not include assumptions around changes in portfolio composition rather how the company changes in production impact the overall portfolio composition.
Understanding the Graph
This chart shows the split between technologies in each sector expected within the portfolio in five years. It also shows what this split if the companies in the portfolio were to align with the scenario. Additionally, it shows this information for the benchmark and for the benchmark if the benchmark portfolio were also to align with the scenario. Please bear in mind that PACTA assumes a static balance sheet for an investor. As such, this ensures that any difference in the technology mix when compared to the current exposure chart, is solely a result of the production plans of the companies the investor is currently financing and not a result of any change in the portfolio composition.
For the sectors with low carbon alternatives, one can see how the exposure to low and high-carbon technologies compares. For the fossil fuel sector, production has been converted to GJ to allow comparison between the three fuel types. The comparison between the fuels is provided for reference.3.3 Alignment of Emission Intensities
For sectors in which there is no low carbon alternative, or even where there is, decarbonization efforts via increasing efficiency in production and use, as well as investment in research and development in the short term, is necessary in order to bring CO2-neutral alternatives to market maturity. This analysis presents the changes in CO2 intensity in comparison with the scenario.
Understanding the Graph
The chart uses the current emissions intensity of companies within the portfolio as a starting point and shows how this expected to develop over the next five years based on the plans of the company and what would be expected under the scenario.
3.4 Company-Level Results
The following section is dedicated to the identification of the companies in the portfolio that have the strongest impact on the results in this report. The analysis in this section can serve as the basis for climate strategies such as engagement, best-in class investment, exclusion or use exercising voting rights, among others. The analysis of this section allows to answer the following question:
Which companies are driving the portfolio’s alignment with climate scenarios?
Which companies are the leaders and laggards with regards to shifting towards low carbon alternatives?
3.4.1 Company low- and high-carbon split
The first chart visualizes the technology exposure and the alignment of companies in the power and automotive sector. Within these sectors, low-carbon technologies compete with high-carbon technologies in the current market, which allows to assess how companies are split.
Companies that are positioned rather left on this graph, own more high-carbon technology, while company on the right side, own more low-carbon technologies. Furthermore, the announced build-out of low-carbon-technologies for each company is compared to the required build-out based on the scenario used for the analysis. Companies that are positioned in the lower part build-out less than companies in the upper part. The importance of each company can be measured by the size of the data point. The radius is determined by the weight of the company in the portfolio. Thus, larger dots represent companies that drive the portfolio results.
Understanding the Graph
The visualization combines current technology mix (x-axis) and alignment information (y-axis) for all invested companies in the chosen sector. Dots positioned further to the right represent companies that have a larger share of low carbon technologies. Dots positioned further up indicate that companies have more ambitious build-out plans in low carbon technologies. The size of the dots represents the weight of the company in the portfolio.
Please note, for the corporate bond portfolio, the results are provided at credit parent level. This is because a single credit parent may be the obliger for the debt and could be associated with multiple companies.3.4.2 Company technology exposure
The most important power and automotive companies in the portfolio according to their weight in the portfolio are shown with their technology mix in the production. The companies’ technology mix is then compared to the portfolio’s future exposure and its aligned exposure.
Understanding the Graph
This chart shows the breakdown of each company’s production capacity in each sector by technology. This is compared to the portfolio, benchmarks and this portfolio if it were to be aligned with the selected scenario. Companies that have higher exposure to a technology than the portfolio drive the exposure of the portfolio to this technology up.
Please note, for the corporate bond portfolio, the results are provided at debt ticker level. This is because a single debt ticker could be associated with multiple companies.3.5 Interpreting the Results
Exposure versus Alignment? How to read these results?
The charts shown in this chapter reflect one of two concepts – exposure and alignment. It is important to consider both when assessing the scenario analysis of the portfolio. The first shows the relative importance of the sector and technology in the portfolio. Where a sector has a relatively low presence in the portfolio, the question of alignment of this sector is relatively less important than in sectors that are more heavily weighted. Similarly, the alignment metrics and graphics do not make comment to how relevant the sector is in the portfolio. Depending on the objectives of the analysis, one metric might be more relevant or decision useful than the other: if you are looking to make an impact in terms of a reduction of real-world emissions, it could be relevant to focus on the companies that are most misaligned and engage them based on these results. If, however, you are looking to minimize exposure to potential transition risks, then focusing on the exposure of your portfolio to different technologies or geographies may have more relevance.
Does this analysis indicate a temperature alignment of my portfolio?
This analysis shows whether the technology specific build out plans of companies in my portfolio are in line with technology roadmaps outlined in energy transition scenarios. This analysis however does not provide a single temperature warming indicator for the entire portfolio. There is no science-based methodology to identify with certainty the implied temperature increase of a portfolio that is aligned with a specific scenario in one sector but not in another. While there are a myriad of ways to “score” climate alignment, there are major challenges related to the interconnectedness and ‘offsetting’ across sectors, uncertainties surrounding data and assumptions, as well as the fact that some technologies and sectors necessary to reach certain temperature targets are not represented in this analysis. Therefore, our research concludes that currently the temperature alignment of a portfolio cannot be represented as a single indicator in a scientifically appropriate way.
3.6 Inevitable Policy Response
The TDM indicates the degree of disruption that your portfolio could experience in 6 to 9 years. This metric measures the adjustments (e.g. decline of coal mining, oil production, increase in renewable power, etc.) needed in the portfolio from year 6 to 9 (2026 - 2030) relative to the portfolio’s pace in years 1 to 5 (2021-2025), in order to be aligned with required decarbonization levels by the FPS (Forecast Policy Scenario) scenario by the end of 2030. A high number means that companies in your portfolio will need to significantly adjust their decarbonization pace in years 6-9 to meet the 2030 goals of the FPS. Thus, the higher the number, the higher the likely portfolio disruption in the medium-term. This metric is meant to be complementary to the alignment model, in the sense that the investors who want to mitigate the policy risk would need to move ahead of the FPS scenario. If investors want a smooth transition to the scenario, they should start adjusting or engaging with companies at a faster or slower pace according to their results.
Understanding the Graph
This graph shows the Transition Disruption Metric (TDM) at a portfolio level and at technology levels within a sector. The portfolio-level result is displayed in the upper gauge and the technology-level results are displayed below it. The default sector for technology results is ‘Automotive’ and the user can change the selection by clicking on the sector name in the title of this part of the chart and choosing a different sector. Only the sectors to which the user’s portfolio is exposed are displayed in the chart. The brown pointer indicates the TDM result calculated for user’s portfolio (at either portfolio o technology level), and the black line indicates the TDM result for the FPS (Forecast Policy Scenario) scenario. Thus, similar to the user’s TDM, the higher the TDM for the FPS, the higher the level of disruption in the scenario itself.
The transition risk based on the TDM metric is considered to be:- ‘Fully Mitigated’ if TDM is equal to 0,
- ‘Manageably Mitigated’ if TDM is between 0 and 1,
- ‘Manageably disruptive’ if TDM falls between 1 and 1.5,
- ‘Unmanagbly disruptive’ if TDM is above 1.5.
- If you wrote the letter in 30 minutes, your TDM is 0. Your work is done ahead of time.
- If you wrote half the letter in 30 minutes, your TDM is 1. You are on track to finish the letter within the hour.
- If you wrote only a quarter of a page in 30 minutes, your disruption is 1.5. You are significantly behind finish the letter and need to accelerate, but it is probably manageable still.
- Anything above 1.5 (anything less than the quarter of the work done after half the time spent) involves significant disruption.
4 Climate Actions and Next Steps
Upon reading this report, one can understand that PACTA is a tool that informs two objectives. First, it informs financial institutions on defining climate actions and setting aspirations related to the alignment of their portfolio with climate goals. While it does not measure the contribution that financial institutions make in terms of real-world emissions reduction, it represents a first step on that journey. A related project (Evidence for Impact) is currently under way to help design methods and approaches to better understand the real-world impact of climate actions by financial market actors.
Second, PACTA can also be considered a mechanism to understand the evolution of transition risk. By measuring portfolio alignment, it informs on the extent to which companies are adapting their business plans to climate scenarios. Misalignment can then speak to potential higher future risk. A number of financial supervisors are currently using the PACTA model for this purpose. However, while PACTA can be an input into risk frameworks, it does not model actual financial losses.
4.1 Climate Action Guide
The information in this report serves as a starting point for better understanding the possible climate actions and strategies that can be implemented. To assist in planning the next steps, 2DII have developed a Climate Action Guide that serves to breakdown the avenues to achieving impact in the real economy.
The Climate Action Guide provides information on climate actions that can be taken and summarises the current evidence that links these climate actions with CO2 reductions. It also can be used to simulate the implementation of climate actions and what effect these would have on your portfolio. This guide can be accessed here through the website where you have received these results.
5 Inputs Into the PACTA Methodology
This chapter covers the core concepts of the methodology, allowing a reader to understand the results being presented in this report whilst aiding them to interpret them correctly. Some of the key assumptions and limitations are also highlighted at the end of this chapter. This is not intended to be a detailed description of the methodology, for more information about it, please refer to the Knowledge Hub on the Transition Monitor website, or to the PACTA for Investors methodology document, also available on the Transition Monitor website.
5.1 Scenarios and Data
5.1.1 Asset-based company level data
The PACTA methodology measures the alignment of a financial portfolio to decarbonization pathways set out in climate change scenarios. It does this by attributing physical assets in the real economy to the financial assets that finance them. The physical asset-based company-level data used in this report is provided by Asset Resolution.
The production values of each company in the dataset provided by Asset Resolution, measured as an economic unit of output, are known. For example, the number of cars produced or barrels of oil for automotive and oil assets, respectively. The asset’s production values are allocated to the companies owning them based on the “Credit Ownership” and the “Equity Ownership” consolidation methodologies. For more information related to the consolidation of physical assets to companies please refer to the PACTA for Investors methodology document.
5.1.2 Scenarios
Climate change scenarios are an important tool to explore and understand what can happen and what may need to happen in the future under different conditions and in order to achieve certain outcomes. Scenarios are only depictions and models of the future and so do not predict what will happen with 100% certainty in the upcoming years. Instead they propose different views of the future, under different political, economic and social contexts and with different possible decarbonization outcomes.
The PACTA Methodology is intended to be agnostic and to be able to use any climate scenario that lays out production capacity targets at the technology level or, for the relevant sectors, emission-intensity units. Scenarios typically differ in the following main ways:
They implement decarbonization pathways of different levels of ambition and probability;
They lay out decarbonization pathways that occur at different speeds (rapid ramp-up or long-term adjustment);
They make different assumptions around innovation and, thus, around technologies’ availability, scalability, and costs;
They offer varying levels of granularity, e.g., they may cover different time horizons and geographic scales.
Given that the targets laid out in climate scenarios can vary by region depending on the sector’s value chain and geographic constraints (e.g., power distribution), alignment is measured at the geographical level in which the sector tends to operate and seek investment. For example, for the power sector, markets tend to be regional or national, and as such, alignment should be measured at that level. However, the oil, gas, coal and automotive sectors operate in a global market and in such a case a global scenario target is used.
Not all scenarios provide information for all sectors analyzed in this report, therefore different sectors might be analyzed using different scenarios. However, in general we recommend using the same scenario where possible when performing the portfolio analysis, since the sectoral pathways within scenarios are created to meet the same overall carbon budget.
We further recommend that investors seek to understand the scenarios used, and their underlying assumptions, in order to evaluate which of them is more appropriate for their purposes. For further information on the scenarios included in this report, please refer to the scenario document available on the Transition Monitor website.
5.1.3 Benchmarks
In the interactive report, the user can select from a drop-down menu the Exchange-traded funds (ETFs) with which to compare his portfolio. ETFs are funds that track a basket of securities, in this analysis they are used as a proxy of world indexes.
The following are currently available:
- Ishares Core S&P 500
- Ishares MSCI ACWI
- Ishares MSCI Emerging Markets
- Ishares MSCI World
- Ishares Global Corp Bond UCITS ETF
More detailed information regarding these ETFs and their constituents can be found in ishares website.
5.1.4 Time horizons
Results given in this report are shown for the present and up to 5 years in the future. This is based on the capital expenditure (CAPEX) plans reported by the company’s present in the asset-based company data (ABCD). For some sectors, a reliable estimate beyond 5 years cannot be made due to the lack of adequate CAPEX forecasts beyond that time frame. In PACTA, for the sake of homogeneity and consistency, we provide the forecast information 5 years forward looking.
5.2 Accounting Principles
5.2.1 Distributing macro carbon budgets to microeconomic actors
Various approaches could be considered when it comes to allocating macro decarbonization efforts to micro-economic actors.
The PACTA analysis uses a market-share approach to allocate macroeconomic climate targets to companies in sectors where low-carbon technologies are available thus, all market-level trends and targets are proportionally distributed across companies such that by contracting/expanding their production in each technology at the same rate, they retain their initial market share. Put differently, each actor in the sector needs to decarbonize as their current market share dictates.
5.2.2 Allocating company climate performance to financial portfolio
Another relevant element of the methodology is the allocation of the company’s climate performance to the financial portfolio. Several approaches exist for such an analysis. PACTA analysis applies two of them.
“Ownership Weight Approach (OA). This approach allocates the production of the physical assets of the companies as a function of the ownership share that the financial asset represents. It is only available for equity as the equity holder has a proportion of the company that is delimited by the number of shares he owns. As the owner of a proportion of the company, they have control over that same proportion in company decision-making. As an example, assume there are two companies that compose a portfolio, each of which issues four shares. The portfolio owns one share of the blue company, which has four power plants, and four shares of the yellow company, which owns two power plants. According to the ownership approach, 25% of the production of the assets owned by the blue company (one power plant) and 100% of the assets owned by the yellow company (two power plants) will be attributed to the portfolio.
“Portfolio Weight Approach (PWA)”. This approach allocates the production of the physical assets of the companies considering the proportion that the company represents in the portfolio. Thus, if a bond of Power Company A represents 10% of the total Power-bond portfolio, 10% of Company A’s production will be allocated to the portfolio. In debt values, it represents a proxy for capital allocation decisions.
5.3 Disclaimers and Limitations of the Analysis
Some of the limitations to the model are outlined here:
Data uploaded from financial institutions: Interactive report results depend on the data uploaded by the user. RMI is not responsible for any validation or audit of the uploaded data.
Climate scenario assumptions: The climate scenarios used present one possible manifestation of how the energy transition aligned with different climate targets could look like. Even though the necessary actions are not controversial (expansion of renewables, retirement of high-carbon technologies), the precise way in which a remaining carbon budget is distributed across sectors can be achieved in different ways according to different scenarios. Furthermore, different models will include different assumptions about the future development and potential of certain technologies. This analysis therefore focuses on those technologies that are proven and available to the market. As a result, this analysis does not consider investments in R&D or early stage private equity, which represent an important way for financial institutions to help bring new solutions to the market. Additionally, while scenarios are expected to incorporate all socioeconomic considerations, they don’t take into account regionally specific policies or regulation. For this reason, it is expected that in some technologies alignment may be more difficult or even unfeasible.
Asset based company level data used: Although the data is sourced from reliable, third-party data providers, errors are possible, either in the production plans themselves, or in mapping the ownership structure of a companies. Furthermore, planned production plans do not necessarily materialize and production forecasts should be interpreted bearing this in mind.
Current fund coverage in the PACTA analysis: Whenever institutions report funds in their portfolios they are converted into equities and bonds assigned to that fund ISIN. To complete this conversion, we rely on external data sources containing information on funds and their compositions.
Scope of the analysis: PACTA does not cover certain sectors, such as agriculture and forestry, even though they are highly relevant for limiting future GHG emissions, due to a lack of available data. Furthermore, asset classes such as sovereign bonds or private equity are also not included in the analysis.
Companies’ plans: Companies’ relative extents of climate alignment are approximated using production capacity-based figures, and do not encapsulate R&D investment, historical record, lobbying expenditures, etc.
Sector classification: PACTA maps asset-based company-level data to financial assets considering sector classification provided by our financial data provider. While RMI performs QA of data included in the analysis, some companies might still be wrongly classified.
5.4 Glossary
- ABCD: Asset based company level data
- APS: Announced Pledges Scenario
- AUM: Assets under management
- ETP: Energy Technology Perspectives
- GECO: Global Energy and Climate Outlook
- GJ/a: Gigajoule per annum
- ICE: Internal combustion engine
- LDV: Light duty vehicles
- MW: Mega Watt
- NZE 2050: Net Zero Emissions by 2050 Scenario
- SPS/ STEPS: Stated Policies Scenario
- SDS: Sustainable Development Scenario
- t/a: ton per annum
- WEO: World Energy Outlook
- CurPo : Current Policies Scenario
- NDC-LTS : Nationally determined contributions and national long-term Net Zero strategies Scenario
- 1.5C-Unif: 1.5°C Uniform Scenario